+26.9%
TEU growth since 2019
Explore the growth, shifts and structural patterns emerging from Manzanillo's trade data over time.
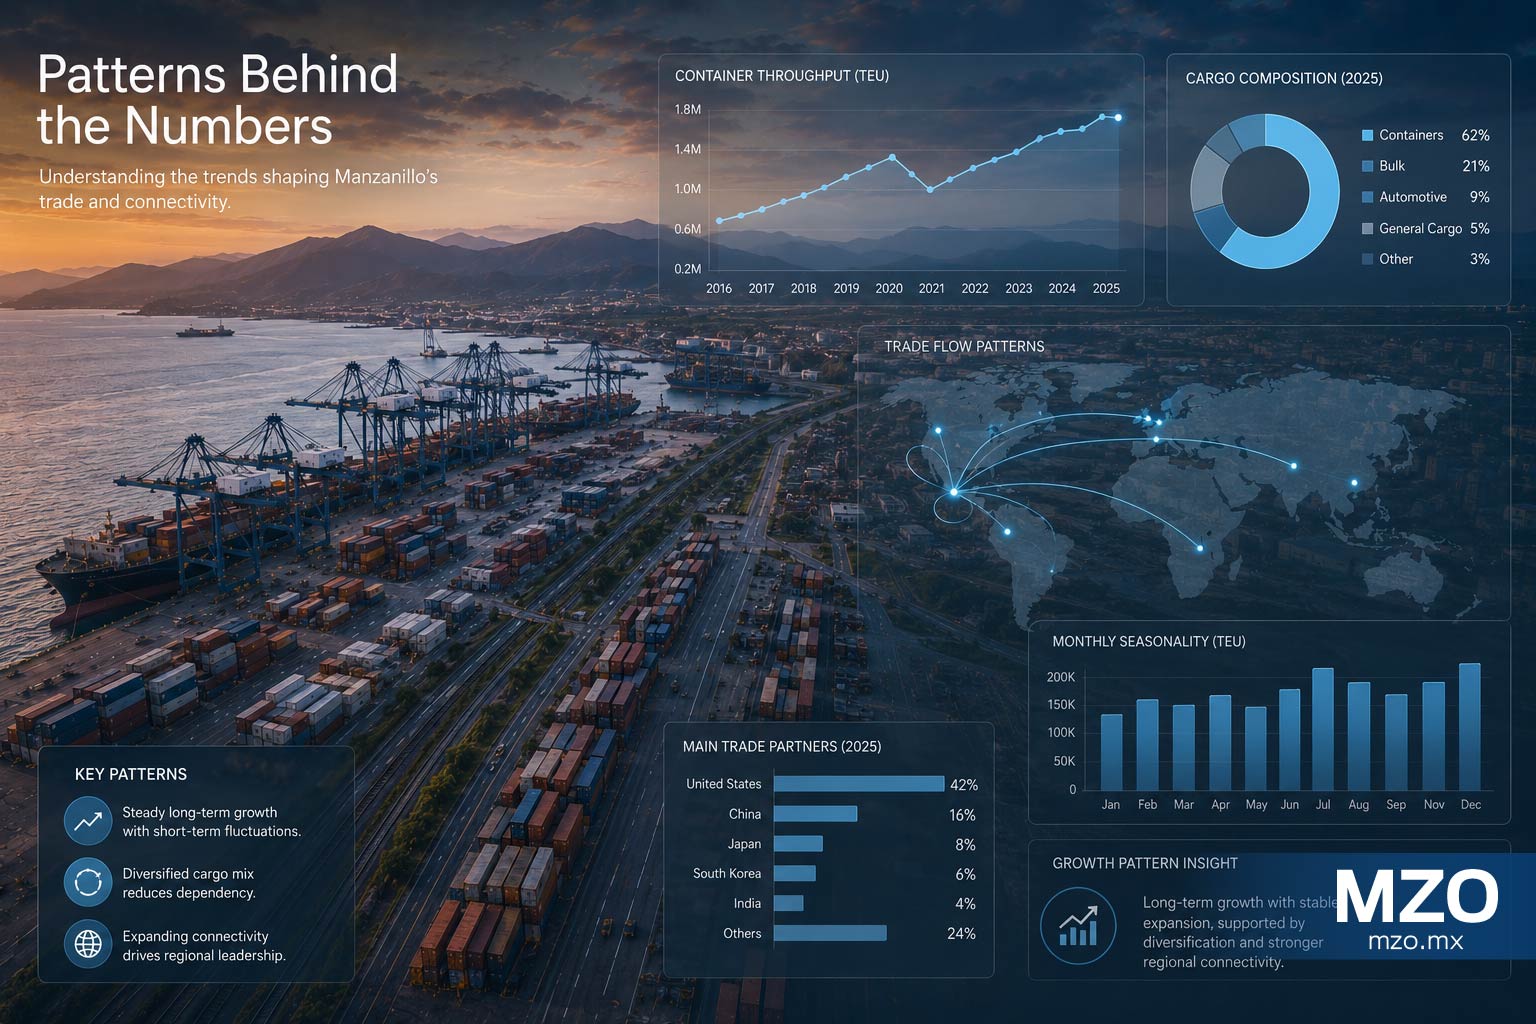
This report is part of the MZO Intelligence platform and presents an editorial analysis based on regional context, public information and strategic interpretation.
Manzanillo's container activity expanded substantially between 2019 and 2025, but the path was not linear and the underlying distribution of activity changed over time. Growth differed across terminal operators, while the slight decline in total activity in 2025 masked divergent movements within the system.
Container activity increased 26.9% between 2019 and 2025, despite a decline in 2020 and a slight contraction in 2025.
Long-term growth was uneven across terminal operators, with some gaining activity while others declined.
The 2025 decrease in total TEU activity was not uniform: Contecon grew while the other operators recorded declines.
Import and export activity continued to account for the large majority of container traffic, while transshipment declined more sharply in 2025.
Four indicators highlight the most visible changes in Manzanillo's container activity between 2019 and 2025.
TEU growth since 2019
TEU change in 2025
Contecon TEU change since 2019
2025 share of SSA + Contecon
The 2025 change in container activity differed by traffic type. Import and export volumes remained broadly stable, while transshipment recorded a more pronounced decline.
Import container activity increased approximately 1.2% between 2024 and 2025.
Export container activity remained broadly stable, increasing approximately 0.1% between 2024 and 2025.
Transshipment declined approximately 8.9% between 2024 and 2025, a sharper movement than either import or export activity.
Total container activity declined approximately 0.8% in 2025, reflecting different movements across traffic types rather than a uniform contraction.
The 2025 non-petroleum cargo mix was strongly concentrated in containerized movement, with mineral bulk forming the second-largest category.
Containerized cargo represented approximately 74% of non-petroleum cargo movement in 2025.
Mineral bulk represented approximately 14.8% of non-petroleum cargo movement.
Agricultural bulk represented approximately 5.8% of non-petroleum cargo movement.
General cargo represented approximately 5.5% of non-petroleum cargo movement.
Annual container activity declined in 2020 before entering four consecutive years of growth from 2021 through 2024. Activity reached a series high in 2024 and then eased slightly in 2025, remaining 26.9% above the 2019 level.
Container activity fell from 3.07 million TEU in 2019 to 2.91 million in 2020.
Container activity increased every year from 2021 through 2024, reaching 3.92 million TEU.
Activity declined slightly to 3.89 million TEU in 2025, approximately 0.8% below the previous year's peak.
Despite the non-linear path, 2025 activity remained approximately 26.9% above the 2019 level.
Manzanillo's trade data shows that changes in total activity can conceal meaningful shifts underneath the headline number. Container activity expanded over the long term, but growth was uneven across periods and terminal operators. The slight decline recorded in 2025 was also internally differentiated, with traffic types and operators moving in different directions. These patterns provide a more detailed view of how the system is changing, while their broader implications require a separate layer of interpretation.
Primary sources and references supporting this report.
ASIPONA Manzanillo
Port Statistics — Historical Container Activity
2025
ASIPONA Manzanillo
Port Statistics — January–December 2025
2025
Continue exploring regional datasets, indicators and visual analysis of the Port of Manzanillo.
Data
Explore the scale, composition, geography and historical evolution of Manzanillo's trade activity through measurable evidence.
Data
Explore what Manzanillo's trade data reveals about scale, structural change and the dynamics beneath aggregate activity.
Data
Browse regional datasets
Data